

To provide our clients with the most current and accurate data on the Omaha market, Investors Realty created its own database of commercial real estate sales greater than $500,000 in 2004. Using this data, the following graphs highlight a few of the market trends we are seeing in the greater Omaha area, and how 2020 compares to previous years in overall sales, building and land sales, and sales volume within each market sector. While 2020 was a challenging year, overall market activity was only moderately impacted.
SALES VOLUME BY SECTOR
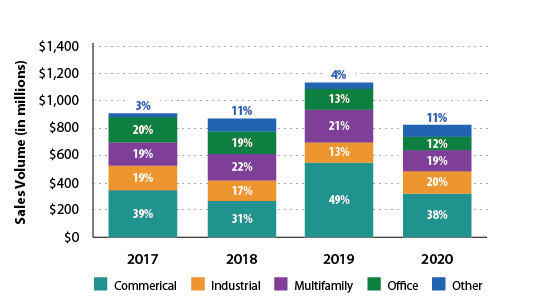
Sales volume percentage in the Commercial sector decreased 10% in 2020 from a previous high in commercial land/buildings in 2019, while other sectors experienced smaller decreases. Industrial faired the best showing a 7% increase in sales volume from $154 million in 2019 to $164 million in 2020.
Office sector sales volume decreased over 34% from $145 million in 2019 to $96 million in 2020. Uncertainty within the Office sector about how office will be used in the future has had a major effect on 2020 sales, but we sense an increase in 2021 and beyond.
The total sales volume decrease is due in large part to COVID-19 uncertainty and shutdowns for the first three to six months of the pandemic. A large percentage of transactions were put on hold or cancelled after March of 2020.
The lack of available Multifamily product for sale has mildly affected 2020 numbers. Steady rent increases over the past decade have caused existing multifamily owners to hold their product. 2020 sales were down from 2019, but we can mostly attribute lack of available product to these numbers.
SALES VOLUME
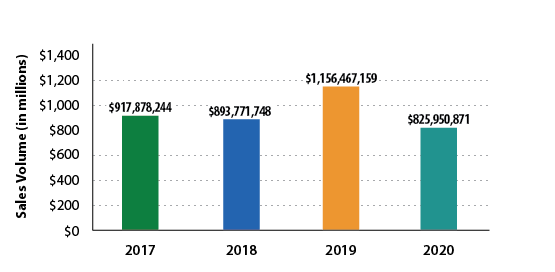
Total sales volume (land and buildings combined) decreased over 29% in 2020 compared to 2019, with over $825 million in total sales (including land and buildings). Buildings in all sectors saw a 42% decrease in sales volume as sales in 2020 were $507 million as compared to $879 million in 2019. Building sales volume last year was the lowest since 2013.
TOTAL NUMBER OF SALES Buildings and Land
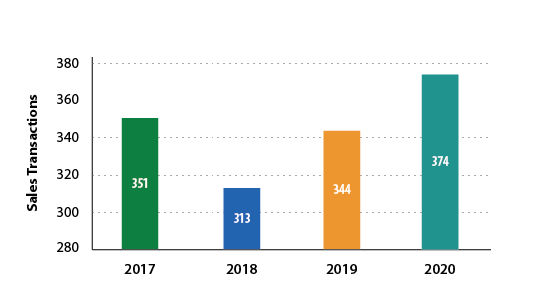
While total sales volume decreased over 29%, the total number of transactions increased 8%. Consequently, the average deal size dropped from $3,361,823 to $2,208,424 with a large number of smaller owner/users taking advantage of low interest rates.
LAND SALES VOLUME
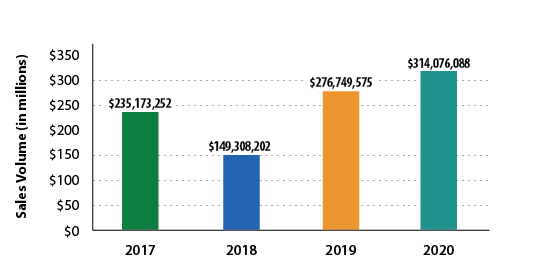
While total sales and building sales were down, Land sales volume increased over 13% in 2020, and the number of land sales transactions increased from 74 in 2019 to 155 in 2020. There seems to be two areas where this increase was most evident. Transitional land sold for new single family or mixed-use developments and Commercial service users such as fast food restaurants, car washes, day care centers and others looking to expand their footprint in suburban commercial corridors. It seems they overlooked the immediate slowdown associated with COVID-19 for a more long term perspective of the need for more of these services in the growing suburban markets.
This article appeared in our company newsletter in March of 2021. Please click here to download the entire newsletter.